CSV Looks Like Excel: A Practical Comparison
An analytical comparison of CSV looks like Excel, clarifying when to use CSV vs. Excel, and how to manage data interoperability, encoding, and performance for data workflows.

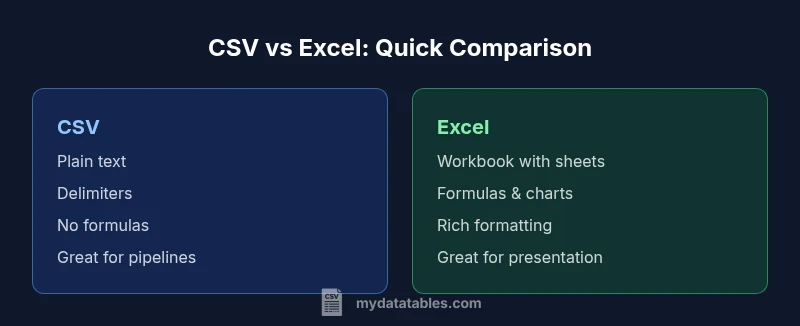
CSV looks like Excel in many everyday workflows because opening a CSV in Excel renders a grid-like view. But this surface similarity hides deeper differences: CSV is plain text with delimiters, while Excel stores rich workbook structure, formatting, and formulas. For data exchange and automation, CSV is typically preferred; for analytics-ready reporting, Excel offers more built-in features. This comparison explains when each format wins.
CSV looks like Excel: What the phrase really means
In data conversations you’ll hear that “CSV looks like Excel” because, when you double-click a CSV file, Excel (and similar spreadsheet apps) renders the content in a grid. Users see rows and columns, header labels, and seemingly familiar values. This visual overlap is convenient for quick inspection, but it’s only skin deep. CSV is a plain-text format that uses delimiters to separate fields, whereas Excel is a binary workbook with sheets, cell formats, charts, and formulas. According to MyDataTables, the practical takeaway is that readability on screen does not imply compatibility for downstream workflows. CSV remains a portable, human-readable data interchange format, yet it does not preserve layout, validation rules, or computed logic—features that Excel can store inside a workbook.
In many organizations, teams treat CSV as a lightweight input for analytics pipelines and dashboards, while Excel files serve as the presentation layer. The MyDataTables team notes that data teams should distinguish between the raw data exchanged via CSV and the presentation or modeling performed in Excel. This distinction matters for reproducibility, auditing, and automation across tools and platforms.
Comparison
| Feature | CSV (plain text) | Excel workbook (XLSX) |
|---|---|---|
| File format | Plain-text, delimiter-based; universal in data exchange | Binary workbook with sheets, formats, and embedded objects |
| Data editing & formulas | Editing via text editors or parsers; no native formulas | Supports formulas, charts, conditional formatting, and macros |
| Encoding & delimiters | UTF-8 (commonly with BOM in Windows environments) and various delimiters | UTF-8 as well, but encoding handling is internal to Excel; often more forgiving with regional settings |
| Size, performance & scalability | Lightweight; better for streaming or very large datasets when parsed incrementally | Heavier; performance depends on features used; large files can be slower to load |
| Portability & interoperability | High across tools and languages; ideal for data pipelines and data exchange | Best within the Microsoft ecosystem; excellent for collaboration when formatting matters |
| Data validation & schema | No built-in validation in the file itself; relies on external schemas | Rich validation, data types, and protection for cells within the workbook |
| Ideal use case | Data interchange, logs, config-like data, simple tabular data | Reporting, modeling, analysis with formatting and automation |
Pros
- Lightweight and text-based, easy to version control
- Wide compatibility across languages and tools
- Ideal for data exchange and ETL pipelines
- Simple to create and parse in automated scripts
- No software lock-in; can be edited with basic editors
Weaknesses
- Lacks native data types; dates and numbers can be misinterpreted
- No built-in formulas or rich formatting when exchanged as CSV
- Quoting and escaping rules can cause edge-case parsing issues
- No workbook-level protections; audit trails depend on external tooling
CSV wins for portability and automation; Excel wins for analytics-ready presentation
If your priority is reliable data exchange and reproducible pipelines, choose CSV. If you need rich formatting, dashboards, and in-app calculations, Excel is the better choice.
People Also Ask
What does CSV stand for and why is it so widely used?
CSV stands for comma-separated values. It’s widely used because it is plain-text, human-readable, and easy to parse across languages and platforms. It supports simple tabular data without requiring a specialized application.
CSV stands for comma-separated values. It’s a simple, portable format ideal for data transfer across systems.
Can CSV look like Excel when opened in Excel?
Yes, Excel renders a CSV file as a grid, which makes it look familiar. However, this is only a display. Formatting, formulas, and multiple sheets are not preserved in CSV.
Opening CSV in Excel shows a grid, but formatting and formulas don’t carry over from CSV.
How should I handle dates and numbers in CSV to ensure consistency?
Prefer a standard date format (e.g., ISO 8601) and enforce consistent numeric formats. When importing into Excel, control regional settings and consider explicit data typing in downstream tooling.
Use ISO dates and consistent numbers; align Excel’s regional settings when importing.
What are best practices for large CSV files in data pipelines?
Stream or batch-process CSV data rather than loading it fully into memory. Use chunked reads, memory-efficient parsers, and validate schemas at the boundary of each stage.
Process large CSVs in chunks and validate data as you go.
When should I convert CSV data into Excel files for reporting?
Convert when end-user presentation and formatting are essential, or when analysts need workbook-level features like charts. For automation, keep CSV in the data layer and generate Excel only when necessary.
Convert to Excel if you need charts or workbook-level features for reporting.
Main Points
- Choose CSV for interoperability and automation
- Use Excel when presentation and built-in analytics matter
- Be mindful of encoding and delimiter choices when exchanging data
- Test CSV import with target tools to avoid surprises
- Document a clear data contract for formats and expectations